Dashboard Overview
A modular analytics dashboard designed to help teams monitor performance, spot trends, and act fast. The challenge was balancing high information density with clarity so key metrics surface immediately while deeper analysis stays accessible.
Skills
Data Visualization
UI Design
Information Architecture
Design Systems
Key Tools
Figma
Adobe Illustrator
Photoshop
Build & QA
Build-ready components with documented states and spacing rules. Validated styling using dev tools and partnered through QA to ensure high-fidelity implementation.
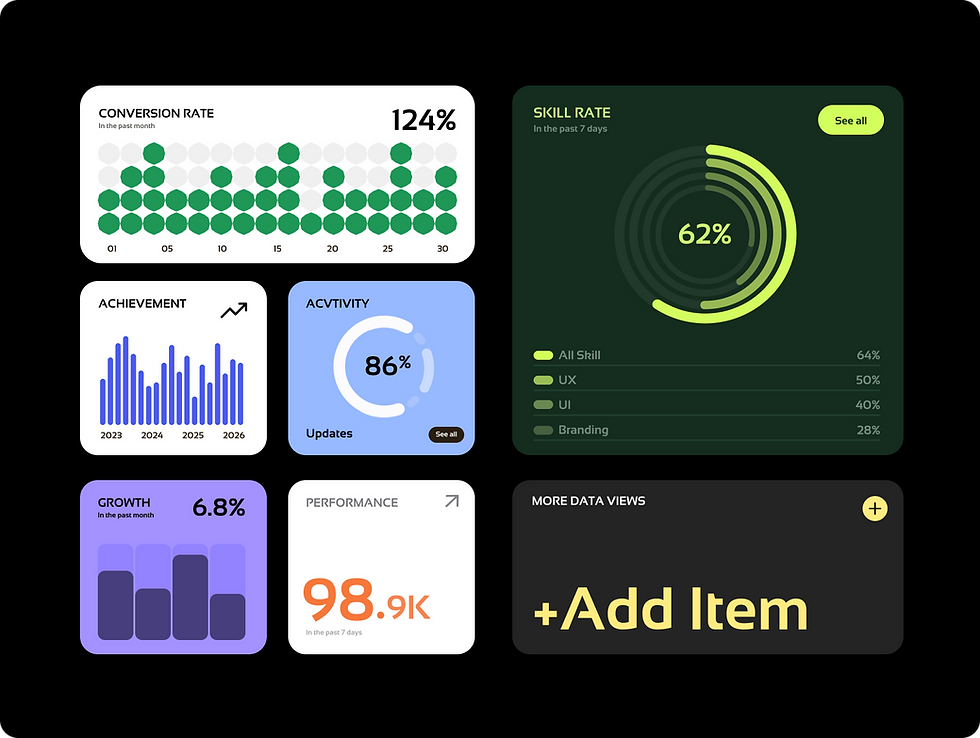

Designing for Dense Data
Analytics dashboards fail when noise competes with signal. I prioritized quick-scan hierarchy, spacing, and progressive disclosure so the most important metrics surface instantly while deeper context stays accessible.
Design Decisions for Scan Speed
Circular progress rings were selected over stacked bars to reduce vertical space and support faster KPI comparison across modules.

Design Focus
-
Modular card-based layout for scalable KPI tracking
-
Quick-scan hierarchy for dense dashboards (grouping, spacing, type scale)
-
Data-viz components designed for comparison and trend recognition
-
Colorway themes for visual grouping and contrast
-
Responsive-friendly components and spacing rules